MaTSE: The Microarray Time-Series Explorer

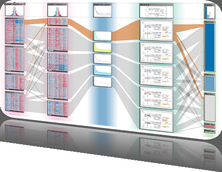
This paper describes the design, development and evaluation of the Microarray Time-Series Explorer (MaTSE), a novel information visualization application for the exploratory analysis of large scale microarray timeseries data. The software combines a variety of visualization and interaction techniques, which work together to allow biologists to explore their data and reveal patterns that would otherwise be impossible to find. These include a scatter-plot that can be animated to view different temporal intervals of the data, a multiple coordinated view framework to support the cross reference of multiple experimental conditions, a novel method for highlighting overlapping groups in the scatter-plot, and a pattern browser component that can be used with scatterplot box queries to support cooperative visualization.
BioVis 2012 Information


