Scalable Interactive Analysis of Retinal Astrocyte Networks
Poster

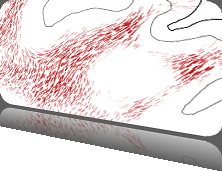
Retinal astrocytes are one of two types of glial cells found in the mammalian retina. We sought to develop an in-depth visual analysis of the astrocyte distribution across the entire retina. Using laser scanning confocal microscopy, whole retinal datasets were captured at high resolution and subsequently assembled into seamless montages. This produces very large images for quantitative and qualitative analysis. Retinal astrocytes are then segmented using a Random Walk method. Here, we address the visualization challenges and report progress on the analysis tools implemented, enabling insights to be communicated both visually and quantitatively.
BioVis 2012 Information


