Towards real-time visualization of detailed neural tissue models: view frustum culling for parallel rendering
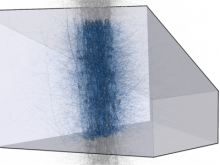
Recent efforts to model neural tissue in great anatomical detail play an important role in the shift towards simulation-based brain research. Visualization of those detailed models is an important part of the scientific workflow, allowing domain scientists to inspect and analyze the models as a virtual tissue. However, these visualizations pose several computational and interface challenges, from issues such as data size and geometrical and visual complexity. Manual or query driven selection of visual attributes such as color, transparency, transfer functions, visibility are important components for the usability of those visualizations, yet this requires the rendering to be as responsive as possible. Given the data complexity (several million triangles) - despite the power of current GPUs - parallel rendering is the only choice to visualize the full circuits at interactive levels. \ In particular, sort-first is an appropriate choice to deal with transparency, however it requires efficient view frustum culling. This paper presents two novel techniques for view frustum culling based on a bounding volume skeleton which is created from the geometrical skeleton of the neurons. These skeletons are combined with spatial partitions and some GPU processing to extract the portions of the neurons that need to be rendered while still facilitating interactive changes in the attributes. Experimental results show that the proposed method yields better results than classical approaches such as OBB-trees and looks promising for sort-first environments. \
BioVis 2012 Information
