Uncertainty-Aware Visual Analysis of Biochemical Reaction Networks

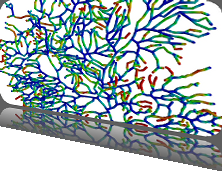
We present a visual analytics system that supports an uncertainty-aware analysis of static and dynamic attributes of biochemical reaction networks (BRNs). These are often described by mathematical models, such as ordinary differential equations (ODEs), which enable the integration of a multitude of different data and data types using parameter estimation. Due to the limited amount of data, parameter estimation does not necessarily yield a single point in parameter space and many attributes of the model remain uncertain. Our system visualizes the model as a graph, where the statistics of the attributes are mapped to the color of edges and vertices. The graph view is combined with several linked views such as lineplots, scatterplots, and correlation matrices, to support the identification of uncertainties and the analysis of their mutual dependencies as well as their time dependencies. To assess the utility of the individual visualization approaches and multiple linked views, a qualitative user study with domain experts was performed. We found that all users were able to process analysis tasks using our system.
BioVis 2012 Information


