Volume Visualization of Serial Electron Microscopy Images Using Local Variance
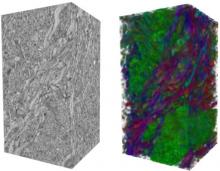
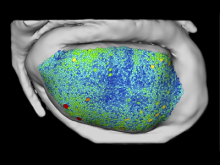
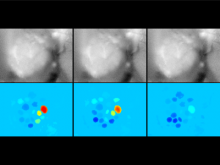
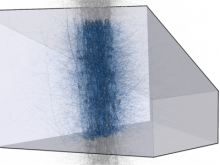
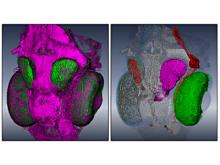
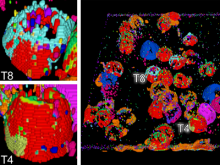
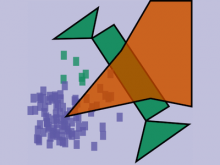
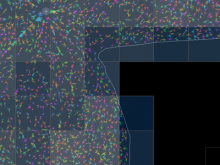
High-throughput microscopy allows researchers to produce large volumetric images of biological tissue at sub-micrometer resolution. Serial electron microscopy (EM) has the ability to improve three-dimensional imaging dramatically by providing nanometer-scale resolution. Serial EM data sets of brain tissue can potentially be used to reconstruct the complex structure of biological neural networks. These data sets consist of gigabytes of volumetric data densely packed with anatomical information. This makes three-dimensional EM data sets difficult to visualize. In this paper, we present new methods for visualizing EM data sets using a novel transfer function based on the local variance of volumetric features. We first construct a tensor field that describes the local shape and orientation of structures. These tensors are then used to visualize anatomical features such as cell bodies, membranes, and fibers. We do this by using the tensor shape and orientation to design transfer functions that allow selective visualization of features in dense EM image stacks.
BioVis 2012 Information
