Program BioVis@Vis
BioVis@Vis 2016 Program
Attended BioVis@VIS 2016? Please fill out our survey and tell us what you thought!
October 23rd, 2016
08:30 - 08:35
08:35 - 09:35
Keynote Lecture
Visualization: The power of alternate representations
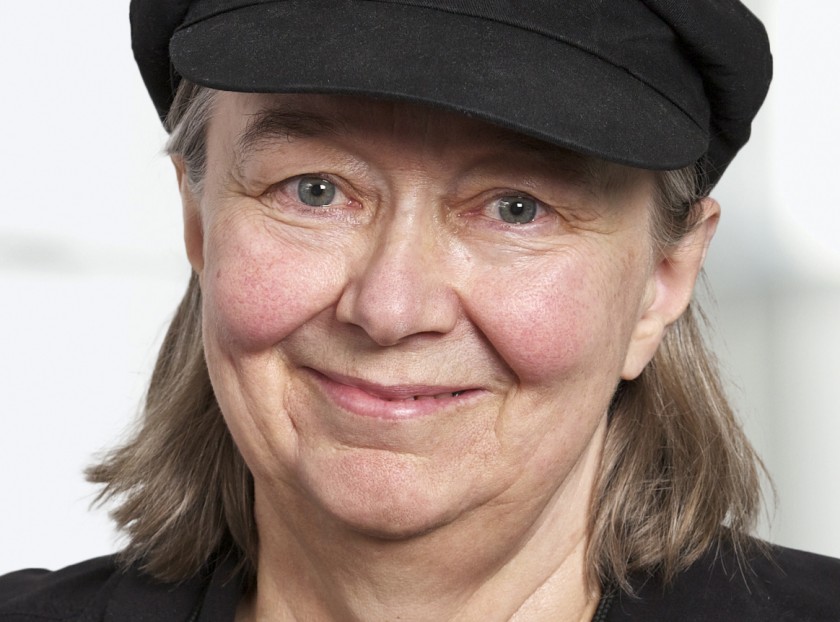
Speaker: Sheelagh Carpendale, University of Calgary, Canada
(Abstract and Speaker Bio)
09:35 - 10:15
Primer
Statistical dances: why no statistical analysis is reliable and
what to do about it
Session Chair: Eamonn Maguire
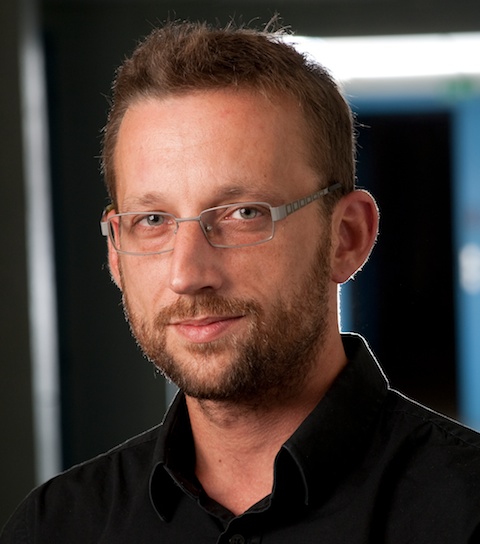
Speaker: Pierre Dragicevic, Inria, France
(Abstract and Speaker Bio)
10:15 - 10:30
Coffee / Tea Break
10:30 - 12:10
BioVis Papers: Abstract Data and Pathway Visualization
Session Chair: Michel Westenberg
(* indicates presenting author)
10:30 - 10:55
Unboxing Cluster Heatmaps
Sophie Engle*, Sean Whalen, Alark Joshi, Katherine Pollard
10:55 - 11:20
PRODIGEN: Visualizing the Probability Landscape of Stochastic Gene Regulatory Networks in State and Time Space
Chihua Ma*, Timothy Luciani, Anna Terebus, Jie Liang, G.Elisabeta Marai
11:20 - 11:45
Generalized Box-Plot for Root Growth Ensembles
Viktor Vad*, Douglas Cedrim, Wolfgang Busch, Peter Filzmoser, Ivan Viola
11:45 - 12:10
A Taxonomy of Visualization Tasks for the Analysis of Biological Pathway Data
Paul Murray*, Fintan McGee, Angus Forbes
12:10 - 14:00
Lunch Break
14:00 - 14:50
BioVis Papers: Protein and Microscopy Data Visualization
Session Chair: Carsten Goerg
(* indicates presenting author)
14:00 - 14:25
Comparative Visualization of Protein Secondary Structures
Lucia Kocincova, Miroslava Jaresova*, Jan Byska, Julius Parulek, Helwig Hauser, Barbora Kozlikov
14:25 - 14:50
Bio-physically Plausible Visualization of Highly Scattering Fluorescent Neocortical Models for in Silico Experimentation
Marwan Abdellah*, Ahmet Bilgili, Stefan Eilemann, Julian Shillcock, Henry Markram, Felix Schurmann
14:50 - 15:15
Virtual Reality Assisted Microscopy Data Visualization and Colocalization Analysis
Rensu Theart*, Ben Loos, Thomas Niesler
15:15 - 15:40
Interactive Exploration of Ligand Transportation through Protein Tunnels
Katarina Furmanova*, Miroslava Jaresova, Jan Byska, Adam Jurcik, Julius Parulek, Helwig Hauser, Barbora Kozlikova
15:40 - 16:00
Coffee / Tea Break
16:00 - 16:45
Challenges Session
Session Chair: Nils Gehlenborg
Challenge: An introduction to Microbiome Data Visualization
Speaker: Eric Franzosa, Harvard School of Public Health (Abstract and Speaker Bio)
16:45 - 17:15
Design Contest Presentations
Session Chair: Eamonn Maguire
Contestant 1: Hamid Younesy (presented by Torsten Möller), Simon Fraser University
Contestant 2: Christian Stolte, New York Genome Center
17:15 - 17:25
17:25 - 17:35
BioVis Data Contest
Speaker: Raghu Machiraju
17:35 - 17:55
Awards Ceremony and Closing Remarks
Jan Aerts
19:00 - 21:00
Keynote Speaker
Visualization: The power of alternate representations
Sheelagh Carpendale, University of Calgary

Abstract:
To visualize data one of the first steps is to develop a visual representation. This representation is a result of a mapping by which the data can be specified. Much has been said of about the power of these visual representations. Simon (1981) said that solving a problem is simply a matter of representing so as to make the solution transparent – implying that finding the right representation solves the problem. Card et al. (1998) said that interactive visual representations can amplify our cognition – can in effect make us smarter. In spite of this, the small box in the visualization creation pipeline that signifies the development of the visual representation remains one of the least unpacked. Through examples from my own work and others’, I will discuss the power and potential of alternate visual representations.
Bio:
Sheelagh Carpendale is a Professor in Computer Science at the University of Calgary where she holds a Canada Research Chair in Information Visualization and NSERC/AITF/SMART Technologies Industrial Research Chair in Interactive Technologies. She has many received awards including the E.W.R. NSERC STEACIE Memorial Fellowship; a BAFTA (British Academy of Film & Television Arts Interactive Awards); an ASTech Innovations in Technology award; and the CHCCS Achievement Award, which is presented periodically to a Canadian researcher who has made a substantial contribution to the fields of computer graphics, visualization, or human-computer interaction. She has served in such roles as Papers, Program, or Conference Chair for IEEE InfoVis, ACM Interaction Tabletops and Surfaces, and Computational Aesthetics and has received both the IEEE and ACM recognition of service awards. She is a co-director of the Interactions Lab and leads the Innovations in Visualization (InnoVis) research group and initiated the interdisciplinary graduate program, Computational Media Design. Her research on information visualization, large interactive displays, and new media draws on her dual background in Computer Science and Visual Arts.
Primer Speaker
Statistical dances: why no statistical analysis is reliable and what to do about it
Pierre Dragicevic, Inria, France

Abstract:
It is now widely recognized that we need to improve the way we report empirical data in our scientific papers. More formal training in statistics is not enough. We also need good "intuition pumps" to develop our statistical thinking skills. In this talk I explore the basic concept of statistical dance. The dance analogy has been used by Geoff Cumming to describe the variability of p-values and confidence intervals across replications. I explain why any statistical analysis and any statistical chart dances across replications. I discuss why most attempts at stabilizing statistical dances (e.g, increasing power or applying binary accept/reject criteria) are either insufficient or misguided. The solution is to embrace the uncertainty and messiness in our data. We need to develop a good intuition of this uncertainty and communicate it faithfully to our peers. I give tips for conveying and interpreting interval estimates in our papers in a honest and truthful way.
Bio:
Pierre Dragicevic is working in the Aviz team at Inria in France as a permanent research scientist. He studies information visualization and human-computer interaction. He co-signed many research articles with p-values until he got frustrated and discovered a vast literature on statistical reform. In 2014 he banished p-values from all his publications. Since then, he has been promoting an approach to better statistical communication based on charts, interval estimation and nuanced interpretations.
Challenge Speaker
A Introduction to microbiome data visualization
Eric Franzosa, Harvard School of Public Health

Abstract:
This talk will introduce the concepts and challenges of visualizing the results of microbial community (microbiome) sequencing projects. We will begin with an overview of current amplicon - and shotgun sequencing-based approaches for generating taxonomic and functional profiles of microbiome samples. We will then discuss methods for effectively representing high-dimensional microbiome profiles in low-dimensional space (ordination). This will include an introduction to the ecological distance measures that underlie microbiome ordination and distinguish it from other dimensionality reduction applications. Following this, we will cover additional topics relevant to visualization of microbiome data, including embedding stratified microbiome profiles on phylogenetic trees, and methods for augmenting common graphical data representations to handle the "quirks" of microbiome data (including compositionality, zero-inflation, and high dynamic range). We will close with an overview of existing platforms for visualizing microbiome data and by pointing out open challenges in the field.
Bio:
Eric received a Bachelors in Biophysics (2006) from Brown University and a Ph.D. Bioinformatics (2011) from Boston University, where he studyied protein structure-evolution relationships with Prof. Brandon Xia. In 2012 he joined Curtis Huttenhower's lab at Harvard School of Public Health/Broad Institute to research metatranscriptomics and microbiome personalization. In 2015 he transitioned to staff scientist role in the Huttenhower lab and is currently researching efficient methods for microbiome functional profiling (HUMAnN2) and expanding the Human Microbiome Project. He is also involved in various Microbiome and bioinformatics workshops and education initiatives.