Program
Schedule
| Sunday (Ballroom B/C) | Monday (Ballroom B/C) | ||
| 08:30 | Welcome Remarks Keynote Lynda Chin | 08:30 | Paper Session 2 - Omics Data |
| 10:10 | Coffee Break | 10:10 | Coffee Break |
| 10:30 | Primer: Molecular Biology and Bioinformatics for Data Visualization Larry Hunter, Kun Huang | 10:30 | Paper Session 3 - Biological Networks, Pathways and Connectivity |
| 12:10 | Lunch Break | 12:10 | BioVis Feedback Session |
| 01:00 | Lunch Break | ||
| 02:00 | Paper Session 1 - Molecular and Image Data | 02:00 | Paper Session 4 - Phylogenetic and Population Data, Morphometry |
| 03:40 | Coffee Break | 03:40 | Coffee Break |
| 04:15 | Poster and Demo Session 04:15 - Fast Forward 04:45 - Viewing | 04:15 | Challenges Session 04:15 - Cydney Nielsen 04:40 - Arthur Olson 05:05 - Willy Supatto |
| 05:30 | Contest and Awards Closing Remarks | ||
| 06:00 | Reception (until 7:30) Posters on display | ||
| 07:00 | BioVis Contest BoF (in Room 557, until 9:00) Meet the Experts & Invitation | ||
Keynote
Translating the Cancer Genomes
Cancer is the phenotypic endpoint of myriad genetic and epigenetic aberrations that collectivey commandeer key cancer-relevant pathways. Comprehensive characterization of the cancer genome holds enormous potential to (i) provide penetrating insight into the genetic bases of cancer, (ii) identify promising candidate therapeutic targets and diagnostic biomarkers, and (iii) illuminate the path toward personalized cancer medicine. However, translating the complex cancer genomic information into biological insights that can impact in the clinic is an enormous challenge that involves multi-disciplinary collaboration from genomic, computational sciences to cancer genetics and disease biology, and clinical arenas. Importantly, such collaboration begins with and depends on accessing and visualizing the data. Examples will be shared to illustrate the importance and need for visualization.
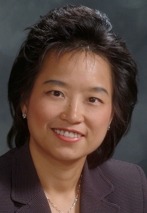
Dr. Lynda Chin has joined University of Texas MD Anderson Cancer Center where she will be the chair of the first ever Department of Genomic Medicine and Scientific Director of the Institute for Applied Cancer Science. For the past 14 years, she has been a member of the Dana-Farber Cancer Institute and Harvard Medical School community where she was Professor of Dermatology at the Harvard Medical School, member of Department of Medical Oncology at Dana-Farber Cancer Institute, and a Senior Associate Member of the Broad Institute. Dr. Chin also served as the Scientific Director of the Belfer Institute for Applied Cancer Science at the Dana-Farber Cancer Institute, and co-led the Dana-Farber / Harvard Cancer Center's Melanoma Program and the Harvard Skin SPORE. At the Broad Institute, Dr. Chin is PI of the TCGA Genome Data Analysis Center. She is also a member of the Scientific Steering Committee of the International Cancer Genome Consortium.
Dr. Chin has made multiple scientific discoveries spanning the fields of transcription, telomere biology, mouse models of human cancer, oncogenomics, and personalized cancer medicine. She co-founded AVEO Pharmaceuticals in 2002, a cancer biotechnology company that emphasizes cancer biology and genetics to identify new cancer targets with tumor maintenance roles. Most recently, Dr. Chin also founded Metamark Genetic, a cancer diagnostic company that will develop function-based prognostic determinants that can guide customized management of early-staged cancer patients including melanoma and prostate cancer.
Dr. Chin received her M.D. from the Albert Einstein College of Medicine in 1993. She is a board-certified dermatologist and conducted her clinical and scientific training at Columbia Presbyterian Medical Center and the Albert Einstein College of Medicine where she served as Chief Resident of Dermatology. Dr. Chin has three young children, ages 10, 9 and 7.
Primer: Molecular Biology and Bioinformatics for Data Visualization
The speakers will provide a general overview of current practices and tools in bioinformatics and also highlight the role visualization can play. More details to follow.
Sense-Making in Molecular Biology
The advent of genome-scale molecular instrumentation has led to an explosion of biomedically relevant data, with nonstop exponential improvements in performance likely to continue for decades. We are truly at an inflection point in the history of life and medicine. However, this deluge presents a significant challenge: making sense of genome scale data is increasingly the fundamental task in molecular biology. In this brief tutorial, we will explore the different sorts of explanations that play a role in understanding life, the sources of knowledge about genes and their effects, and the process of integrating knowledge and data about mul- tiple genetic differences into a coherent story about mechanism.

Lawrence Hunter is the Director of the Computational Bioscience Program at the University of Colorado School of Medicine, and is a Professor in the departments of Pharmacology and Computer Science (Boulder). He received his Ph.D. in computer science from Yale University in 1989, and then spent more than 10 years at the National Institutes of Health, ending as the Chief of the Molecular Statistics and Bioinformatics Section at the National Cancer Institute.
He inaugurated two of the most important academic bioinformatics conferences, ISMB and PSB, and was the founding President of the International Society for Computational Biology (ISCB). He was named a Fellow of the ISCB in 2009.
Larry's research interests span a wide range of areas, from cognitive science to rational drug design. His primary focus recently has been the integration of natural language processing, knowledge representation and machine learning techniques and their application to interpreting data generated by high throughput molecular biology.
Applications and Computing Challenges with Next Generation Sequencing
During the past five years, Next Generation Sequencing (NGS) technology is changing biomedical research in a revolutionary way. For the first time, researchers can directly study the genome at single-base resolution in a relatively inexpensive manner. There have been many applications utilizing these technology including ChIP-seq (protein-DNA interaction), RNA-seq (transcriptome), SNP discovery, methylome, genome de novo sequencing and re-sequencing. The high accuracy and high throughput of the technology also leads to quick accumulation of huge amount of data. In this talk, I will give an overview on a few applications of NGS in cancer research and the challenges associated with the large data including data visualization, analysis, management, and integration.
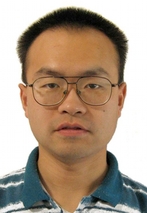
Kun Huang received two B.S. degrees in biology and computer science from Tsinghua University, Beijing, China, in 1996. In addition, he received the M.S. degree in physiology in 1998, the M.S. degree in electrical engineering in 2000, the M.S. degree in mathematics in 2002, and the Ph.D. degree in electrical and computer engineering in 2004, all from the University of Illinois at Urbana-Champaign. Currently he is an Associate Professor in the Department of Biomedical Informatics, The Ohio State University (OSU), Columbus, Ohio, USA and the Co-Director of the OSU Comprehensive Cancer Center Biomedical Informatics Shared Resources. His research interests include computational biology, bioinformatics, biomedical imaging analysis, computer vision, and machine learning.
Paper Session 1 - Molecular and Image Data
Session Chair: Chris Johnson, University of Utah, USA
Paper Session 2 - Omics Data
Session Chair: Matt Hibbs, The Jackson Laboratory, USA
 Abstract - G-nome Surfer: a Tabletop Interface for Collaborative Exploration of Genomic Visualization
Paper Session 3 - Biological Networks, Pathways and Connectivity
Session Chair: Guy Melançon, University of Bordeaux, France
 HiTSEE: A Visualization Tool for Hit Selection and Analysis in High-Throughput Screening Experiments
 Abstract - InBox: In-situ Multiple-Selection and Multiple-View Exploration of Diffusion tensor MRI Visualization
Paper Session 4 - Phylogenetic and Population Data, Morphometry
Session Chair: David Duke, University of Leeds, UK
 Evaluating the VIPER pedigree visualisation: detecting inheritance inconsistencies in genotyped pedigrees.
Poster and Demo Session
Authors of accepted abstracts will be presenting their posters and interactive demos during this session. The session will be opened with a brief Fast Forward that will include all accepted abstracts. During the Fast Forward, one author from each abstract will have 30 seconds to present a slide summarizing their work and promote their poster/demo to the symposium attendees.
The list of accepted abstracts is available in the Papers & Abstracts section.
Reception
This will be a joint event with the Large-Scale Data Analysis and Visualization Symposium and will be open to all VisWeek attendees. BioVis posters and demos will continue to be on display during the reception.
This event is made possible by the generous financial support provided by Autodesk and Agilent Technologies.
BioVis Feedback Session
This session will provide an opportunity for all interested attendees to discuss the BioVis 2011 meeting and plans for future meetings with members of the Organizing Committee. Everybody is welcome!
Challenges Session
We have selected a range of speakers that, together with the keynote speaker, will cover developments in a broad range of active research topics in modern biological data visualization, from genes to proteins to organisms to populations. The speakers include developers of visualization tools widely used in biology, as well as active users who apply visualization methods to discover new biological knowledge.
Visualizing next-generation genomic data
As our ability to generate sequencing data continues to increase, data analysis is replacing data generation as the rate-limiting step in genomics studies. This talk will highlight some of the key visualization approaches that currently facilitate genomic analysis tasks by enabling researchers to explore, interpret and manipulate their data. I will emphasize the challenges ahead, particularly in terms of data representation and the integration of visual and computational analysis techniques.
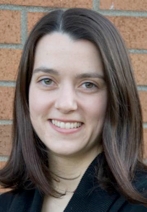
Cydney Nielsen is a Postdoctoral Fellow at the BC Cancer Agency's Genome Sciences Centre. She completed her PhD in Computational Biology at MIT where her work in Chris Burge's lab focused on understanding mammalian post-transcriptional gene regulation. Motivated by the analysis challenges posed by high-throughput sequencing technologies, her current research exploits synergies between human visual reasoning and machine computation in order to address pressing questions in genomics. Her work on a genome assembly visualization tool, ABySS-Explorer, won a Best Paper award at the 2009 IEEE Information Visualization Conference.
Visualization of biomolecular assemblies and environments
Gaining insight into biological processes at a molecular scale requires visualizing biological assemblies using a synthesis of both abstract & 3D visualization. This talk will highlight currently emerging methods used for exploring molecular recognition and self-assembly using hybrid user interfaces that combines 3D solid printing and augmented reality environments, as well as methods for fast, integrated, and large-scale macromolecular visualization.
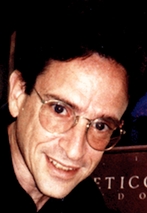
Arthur Olson is the Anderson Research Chair Professor in the Department of Molecular Biology at The Scripps Research Institute and founder and director of its Molecular Graphics Laboratory. He received his B.S. (Honors) in Chemistry from the University of Michigan and his Ph.D. in Physical Chemistry from the University of California, Berkeley. He was a Damon Runyon Postdoctoral Fellow at Harvard University, working on the first atomic resolution structure of an intact viral capsid.
He is a pioneer in the analysis and visualization of biological assemblies spanning length scales from microns to angstroms. His laboratory has developed, applied and distributed a broad range of molecular modeling and visualization software tools over the past 25 years, including AutoDock, which is the worlds most highly cited ligand protein docking code. He started the first Internet distributed biomedical computing project, FightAIDS@Home, which is now running on over a million computers worldwide, and which was honored by resolution in the California State Legislature. His latest work in molecular graphics focuses on the development of novel and intuitive human interfaces for research and education in structural molecular biology utilizing solid printing and augmented reality technologies. Olson's visualizations and animations have reached a broad audience through public venues such as the Disney EPCOT center, PBS television, and a number of art and science museum exhibits around the world.
Visualizing embryonic development
Advances in microscopy now allow collection of 4D image data of embryonic development at unprecedented time and spatial resolution. This talk shows how this image data is being used to reveal new insights into developmental patterns, and highlights the need for more specifically-tailored visualization tools to manage these multidimensional data. The talk also discusses the challenges of combining data from multiple experiments, integrating raw imaging data and performing multidimensional analysis.
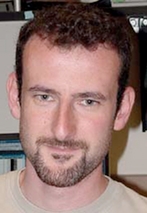
Willy Supatto is a tenured CNRS researcher at the Laboratory for Optics and Biosciences at Ecole Polytechnique (Palaiseau, France) since 2011. He received a M.Sc. degree in Physics and Chemistry from ESPCI ParisTech (Paris, France) and a M.Sc. degree in Biophysics from Paris University. He completed his Ph.D. in Biophysics at Institut Curie in Paris where his work in Emmanuel Farge's lab focused on developing new imaging and optical manipulation strategies to investigate biomechanics during embryonic morphogenesis. In 2006, he joined the Biological Imaging Center at the California Institute of Technology (Caltech, Pasadena, USA) to pursue postdoctoral studies with Pr. Scott E. Fraser within the Center of Excellence in Genomics Science. He developed microscopy, optical manipulation and image analysis tools to study symmetry breaking, fluid flow dynamics and collective cell migration in living embryos. He joined the Ecole Polytechnique in 2011 as a CNRS researcher to pursue pioneering investigaion of embryonic development using quantitative imaging.
BioVis Contest BoF - Meet the Experts & Invitation
The foremost purpose of applying visualization to biology is to improve biological experts' access to information, and the BioVis Contest exists to help visualization experts develop tools that are better suited for that purpose. Come meet the biological domain experts who created the data for this year's contest, and talk with real users of eQTL data who desperately need better tools. Learn more about the domain, and the end users' real needs.
Find out what's brewing for Round 2 of the eQTL data analysis challenge, and help plan the theme for the next BioVis Round 1 challenge.


